
A fishbone diagram template, also called an Ishikawa or cause and effect diagram, helps a team trace a problem back to its possible root causes. The problem sits at the ‘head’ and the causes branch off the ‘spine’ in categories such as people, methods, materials and equipment.
Download eight free fishbone diagram templates below in Word, Excel and PDF, including blank and example diagrams.
What’s Included
- Fishbone diagram templates in PDF
- Blank fishbone diagram templates in Word
- Editable fishbone diagrams in Excel (.xls and .xlsx)
- Cause and effect diagram samples
- Category branches you can rename for your problem
| Template | File format | Hosted on |
|---|---|---|
| Fishbone Diagram Template | GetWordTemplates | |
| Cause and Effect Diagram Sample | GetWordTemplates | |
| Blank Fishbone Diagram Template Word | Word (.docx) | GetWordTemplates |
| Fishbone Diagram Sample for Free | GetWordTemplates | |
| Fishbone Diagram Editable | Excel (.xls) | GetWordTemplates |
| Blank Fishbone Diagram Template | GetWordTemplates | |
| Editable Fishbone Digram | Excel (.xlsx) | GetWordTemplates |
| Fishbone Diagram Powerpoint Sample | GetWordTemplates |
Download the Free Fishbone Diagram Templates
All eight files are free. Click a preview or download button to save one.
Fishbone Diagram Template


Cause and Effect Diagram Sample

Blank Fishbone Diagram Template Word

Fishbone Diagram Sample for Free

Fishbone Diagram Editable

Blank Fishbone Diagram Template
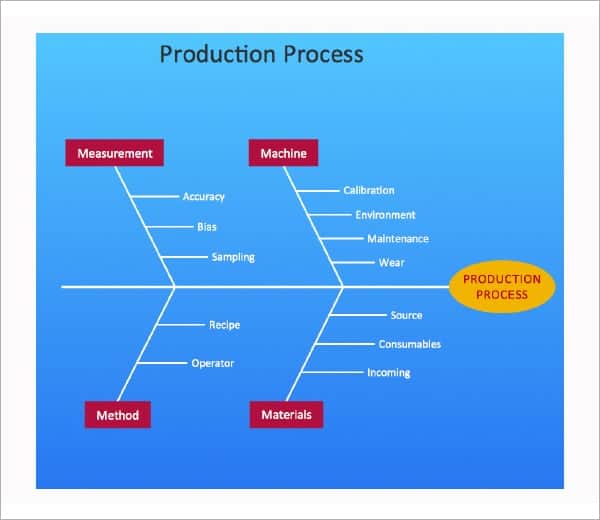
Editable Fishbone Digram

Fishbone Diagram Powerpoint Sample

How to Use These Templates
- Write a clear, specific problem statement in the head of the fish.
- Choose cause categories, such as people, methods, machines, materials, measurement and environment.
- Brainstorm possible causes with your team and add them to each branch.
- Ask ‘why?’ repeatedly to dig into deeper causes.
- Highlight the most likely root causes and check them with data.
- Agree actions to test or fix the confirmed causes.
Who It’s For
Fishbone diagrams are used by quality teams, operations and manufacturing managers, healthcare teams, project managers, teachers and students.
- Quality and process improvement
- Manufacturing and production problems
- Customer complaints and service issues
- Lean, Six Sigma and classroom exercises
Tips for Creating an Effective Fishbone Diagram
- Make the problem specific. ‘Late dispatches in March’ is better than ‘delivery issues’.
- Involve the right people. Include those who know the process first-hand.
- Capture causes, not solutions. Solve later, once causes are clear.
- Verify with evidence. A cause on the diagram is a hypothesis until data supports it.
- Keep it readable. Use short phrases on each branch.
Worked Example: Investigating Late Dispatches
Put “orders leaving after the agreed cutoff” at the diagram’s head. Under process, list delayed approval as a hypothesis; under information, list missing addresses; under equipment, list label-printer outages. These are possible causes to investigate, not findings established by drawing the diagram. Record what evidence would support or reject each hypothesis.
Compare timestamps, error records and observations before selecting a corrective action. If approvals are late only on particular days, test that pattern rather than blaming staff in general. The ASQ fishbone guide explains the tool’s role in organizing possible causes. Move confirmed findings into an owned action plan and check whether the change improves the measured problem.
Carry the investigation into practical follow-up with our incident report templates, standard operating procedure (sop) templates, action plan templates.
Frequently Asked Questions
What is a fishbone diagram?
A fishbone diagram is a visual tool for identifying the possible causes of a problem, grouped into categories along a fish-shaped layout.
Who invented the fishbone diagram?
It is credited to Kaoru Ishikawa, which is why it’s also called an Ishikawa diagram.
What are the 6 Ms of a fishbone diagram?
A common set is Man (people), Methods, Machines, Materials, Measurement and Mother Nature (environment).
Related Templates
Download a free fishbone diagram template above and get to the root of your next problem with your team.

You must be logged in to post a comment.